


This guest article is by Mar Rubio-Varas, Professor of Economic History in the Department of Economics at the Universidad Pública de Navarra (UPNA) and a research fellow at the Institute for Advanced Research in Business and Economics (INARBE), currently Research Fellow at Clare Hall and the Faculty of History, University of Cambridge.
If you want to understand the modernization of an economy, follow the power lines. We recently set out to answer a highly specific question about mid-century Spain: how much of the electricity used by Spanish industry was self-generated (produced by autoproductoras) versus bought from the public grid (servicio público)? And more importantly, how did that split evolve as the country industrialized from the late 1950s onward? It’s a timely question. Self-consumption is being blamed for pushing up costs on both sides of the Atlantic (here, here and here), and energy economists are split: some want more self-generation, others want to cut it down and its subsidies scrapped for good. But industrial electricity self-consumption is nothing new. Alcoa’s aluminum smelters at Niagara Falls started out in 1895 as the local hydro utility’s very first customer, and within little more than a decade the company was building its own power plants to feed them. Who should generate, and who should pay for the grid everyone else still needs: it’s a fight that’s well over a century old.
The answer lived inside a single statistical table hidden in old electricity statistics in Spain. The problem was that we didn’t know how far through time this table survived, where it sat in each annual yearbook, or if the data could even be extracted without months of manual transcription.
Here is how we turned a massive, heterogeneous archive into a single, clean historical narrative using a mix of traditional historical sleuthing and AI.
The Archival Minefield
Our raw material was the annual Estadística de la Industria de la Energía Eléctrica, published by Spain’s Ministry of Industry (today MITECO), starting in 1958. These are publicly available online.
As a corpus, it is a veritable museum of document technology spanning 60 years. The manifest listed roughly 199 files found online, with a real data payload of 87 PDFs, 29 spreadsheets, and 19 archives. Tracking a single table through this collection meant navigating three distinct eras of data storage:
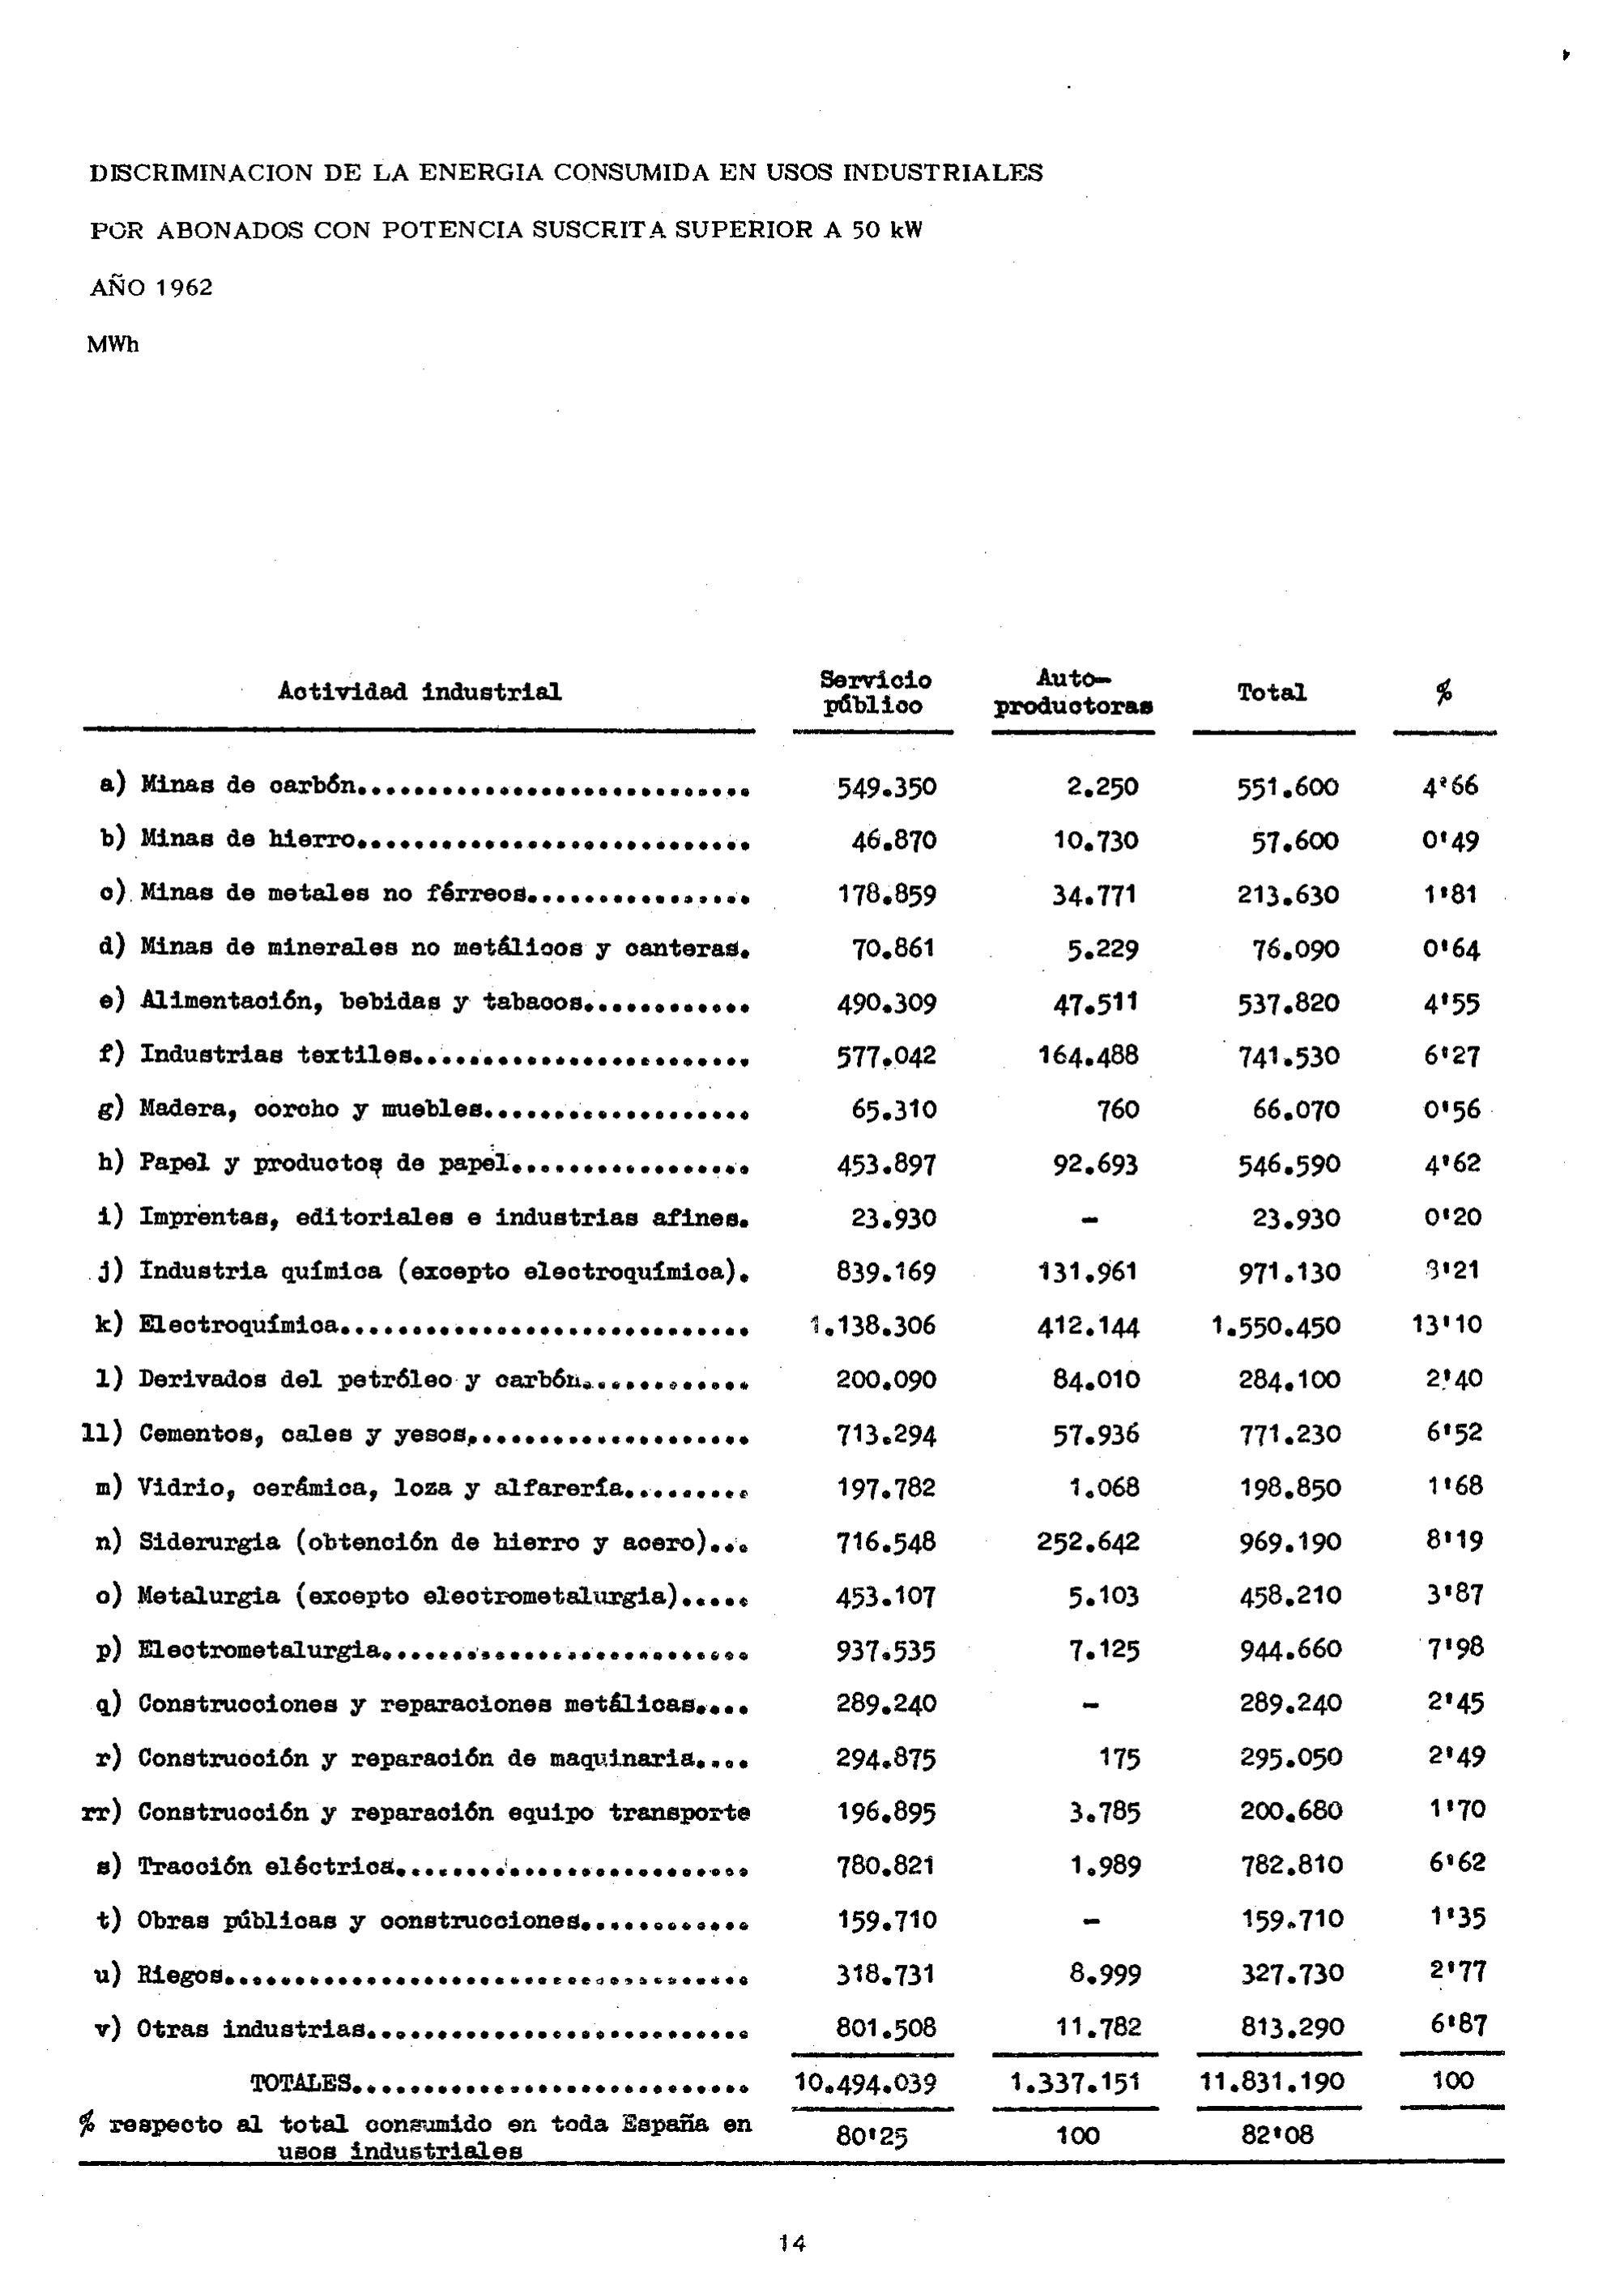
1958–1993: Scanned PDFs of printed books. These are images only, with no searchable text. They feature landscape tables rotated 90 degrees and old-school apostrophe-style decimals (e.g., 6’31).
1994–2012: ZIP archives containing fixed-width plain-text tables that are beautifully machine-readable.
2013–2024: ODS spreadsheets and born-digital PDFs with a flawless text layer.
The same table changes format, filename, layout, and even statistical definition across the decades. We needed a pipeline that could handle all of it. Luckily, Lorenz Hufe and Niclas Griesshaber have created Chronos: The AI Co-Historian, and came to UPNA to explain it in a hands-on workshop for our economic history group. Here is what I achieved in one morning.
The Workflow: AI meets the Historian
Phase 1: Local Triage (The Cheap Work)
Before throwing expensive AI models at the problem, we inventoried and classified every file using simple, local Python scripts. We used basic file triage, unzip, text extraction, and regular expressions to determine page counts and distinguish scanned documents from text-searchable ones. This work quickly confirmed that from 1994 onward, the table was already plain text, and it ran continuously until 2015 (later renamed to “energía distribuida/comercializada por sectores”). It also told us exactly which early years would require heavy image processing.
Phase 2: The Human Skim
For the scanned 1958–1969 books, the cheapest and most reliable “table detector” isn’t an algorithm—it’s a historian. Instead of letting an AI blindly scan 4,000 pages, a human skimmed the volumes and recorded a simple one-line reference for each year: year | file | PDF page | short title.
This step paid immediate dividends. We discovered that the 1959 and 1960 target table was absent from the original scan (someone forgot to scan those pages, it should be somewhere in the paper copy).
Phase 3: Render and Read
With the exact pages flagged, we set up a fully local pipeline. We used PyMuPDF to render the target PDF pages into crisp 300-dpi images, and Tesseract (loaded with Spanish and old-orthography models) for a free, first-pass OCR.
Only the final, flagged table images were sent to the AI vision model. The AI is remarkably adept at reading faint, comma-decimal tables that trip up standard OCR. For each page, Chronos returned a structured, machine-readable record: sector label, public-service MWh, self-producer MWh, total MWh, and the printed percentage.
Phase 4: Paranoia and Verification
Never trust the first read. We cross-checked the local OCR against the vision model’s output and subjected every table to strict arithmetic validation. The sector rows had to sum to the printed total, and within each row, the equation was absolute: public service + self-producers = total.
This mathematical paranoia caught real errors. Two cells in 1963 and one in 1961 had been misread by the models. In each case, the printed percentage column acted as our tie-breaker. If a value read as 3.11% in one column and 4.60% in another, we could reverse-engineer exactly which digit the AI had hallucinated. After these corrections, all seven comparable years reconciled to the exact megawatt-hour.
During this verification, we also uncovered a genuine methodology break in 1967. The Ministry switched from a lettered list of industrial uses (subscribers over 50 kW) to a broader, numbered list of all consumer sectors. Because the two aren’t directly comparable, we treated them as separate blocks, choosing to focus exclusively on the clean 1958–1966 industrial series for our initial analysis. We also had to explicitly map a subtle 1962 reclassification (the sudden insertion of an Irrigation row) so the sectors lined up perfectly across the decade.
The Payoff: What the Data Shows
Once the verified records were consolidated into a long-format dataset and a sector-by-year matrix, the historical narrative finally emerged (all within the same conversation in Chronos AI!)
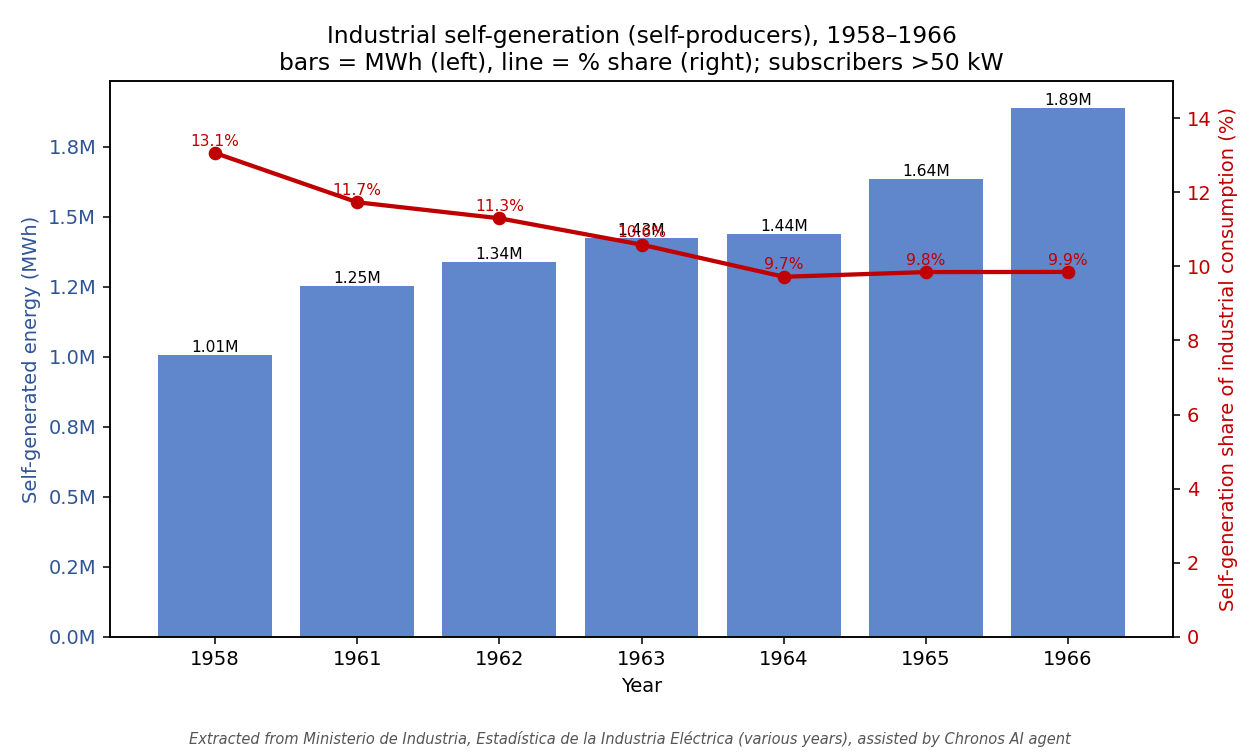
Between 1958 and 1966, Spanish industrial self-generation almost doubled in absolute terms, climbing from approximately 1.0 to 1.9 million MWh. Yet, despite this massive investment in private generators, self-generation’s share of total industrial consumption fell steadily from about 13% to 10%.
The takeaway is clear: while industry kept building its own capacity to keep the lights on, grid supply from the public-service utilities was growing even faster. Throughout the 1960s, Spanish industry was progressively, and permanently, electrifying from the public grid.
Next step will be to continue using Chronos up to 2024, to figure out whether industrial self-consumption in Spain follows a U-shaped trend rather than a continued decline over time, identify the sectors more prompt to self-consumption and try to understand how that has changed over time. But none of this would have been possible without Chronos, The AI Co-Historian, specifically designed for economic history tasks. A whole new set of questions can now be answered with data that already existed, but that was impossible for humans alone to handle.
Wow great article with some great insights.I am currently working on digitization for records from 1560 to date and for the results current OCR/VLMs somewhat struggle on records these old especially the tables.